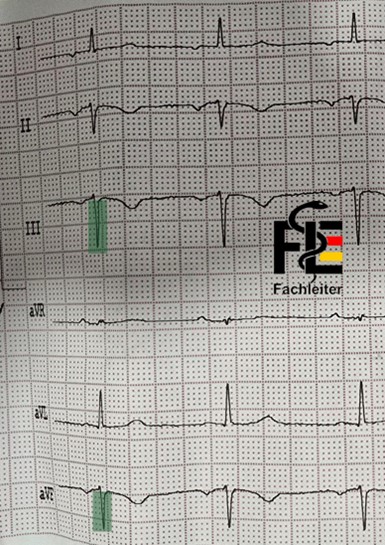
Step 1
Check name and dateStep 2
Technical details
Leads: 12-lead ECG (I, II, III, aVR, aVL, aVF, V1–V6) Speed: 25 mm/s Calibration: 10 mm/mV → calibration trace with 1 mV deflection = 10 mm visible Quality: assessable A small box of 1 mm corresponds to 0.04 seconds (40 ms), while a large box of 5 mm corresponds to 0.2 seconds (200 ms, i.e. one fifth of a second).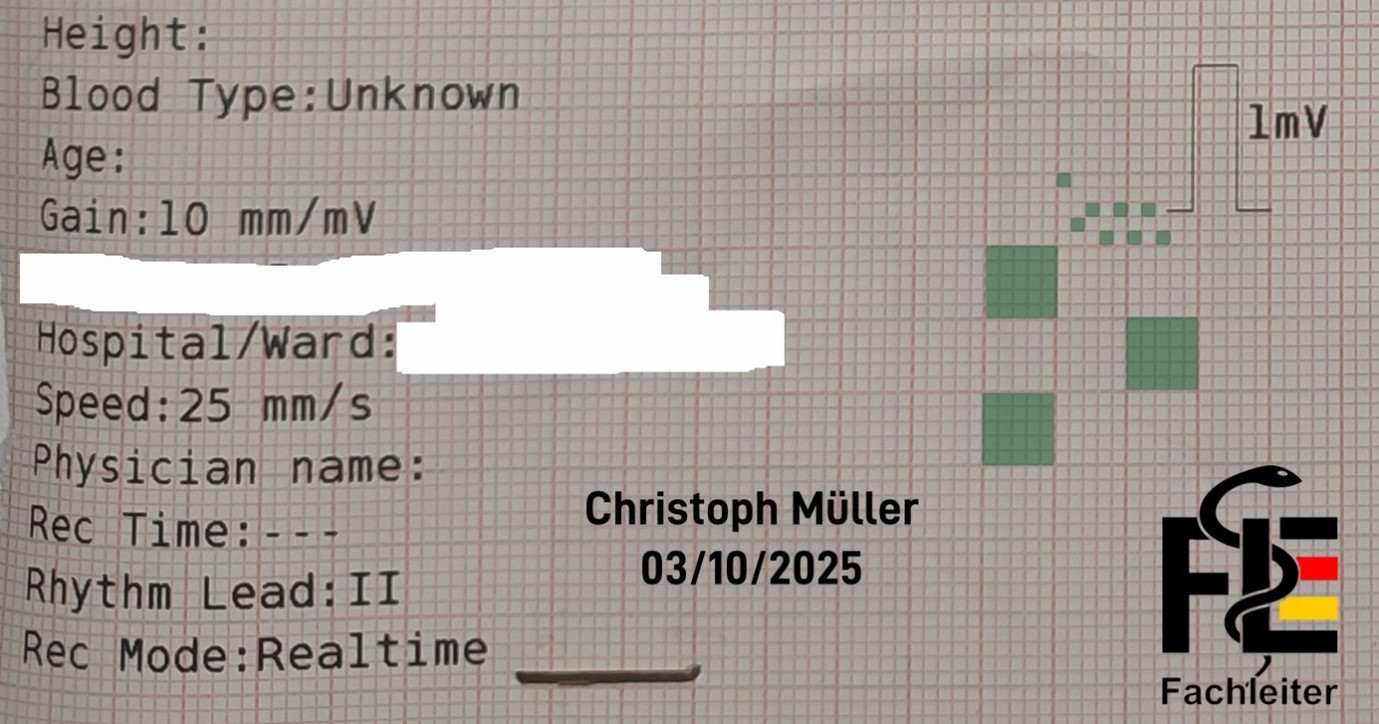
ECG waveforms
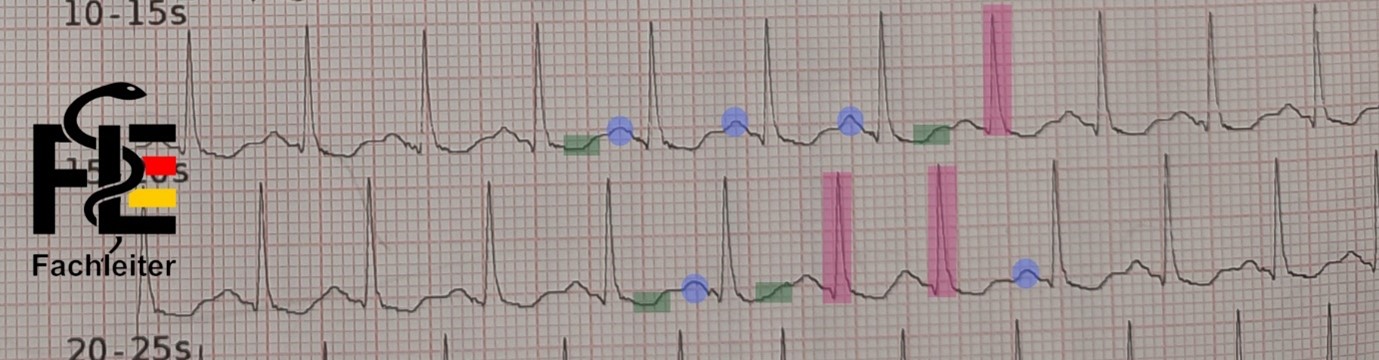
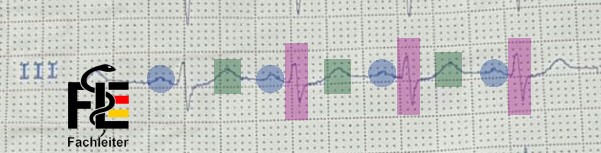
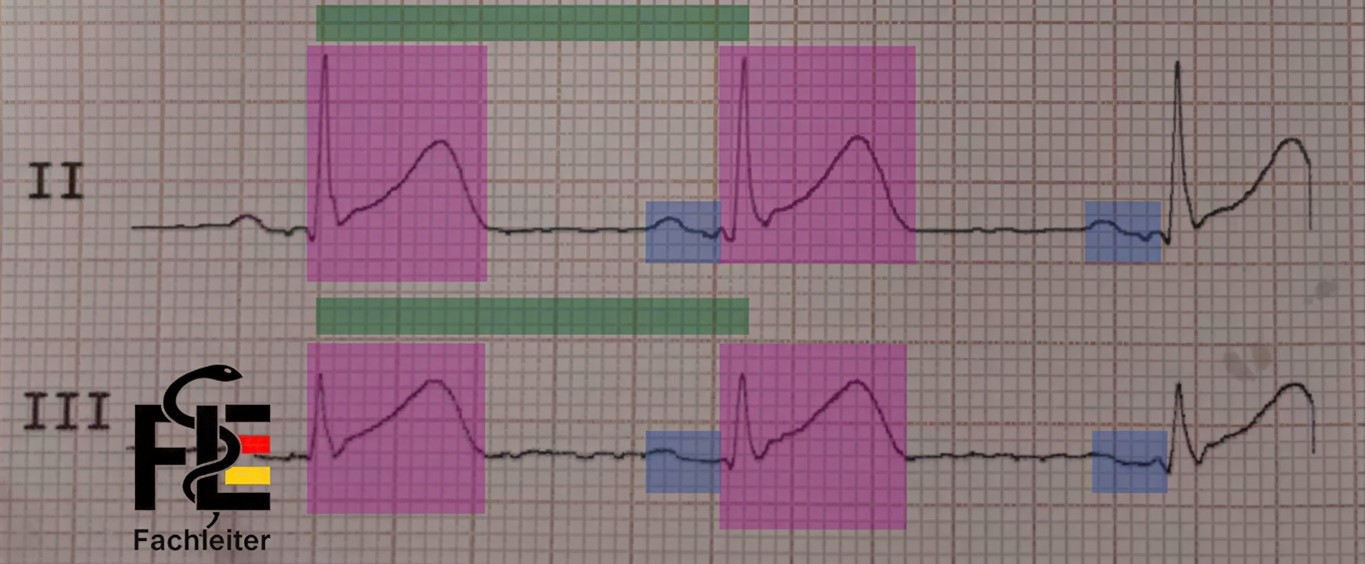
P wave
Represents the spread of depolarization in the atria (atrial depolarization). The normal P wave is usually less than 2.5 mm in height and shorter than 0.12 seconds in duration. In sinus rhythm, P waves are always negative in lead aVR and positive in lead II. Additionally, P waves show similar, though not identical, shapes across all leads.QRS complex
Shows the spread of depolarization in the ventricles (ventricular depolarization). It consists of the Q, R and S deflections. The first negative deflection of the QRS complex (below the baseline) is called a Q wave. The first positive deflection in the QRS complex is called the R wave. If a negative deflection follows the R wave, it is called an S wave.T wave
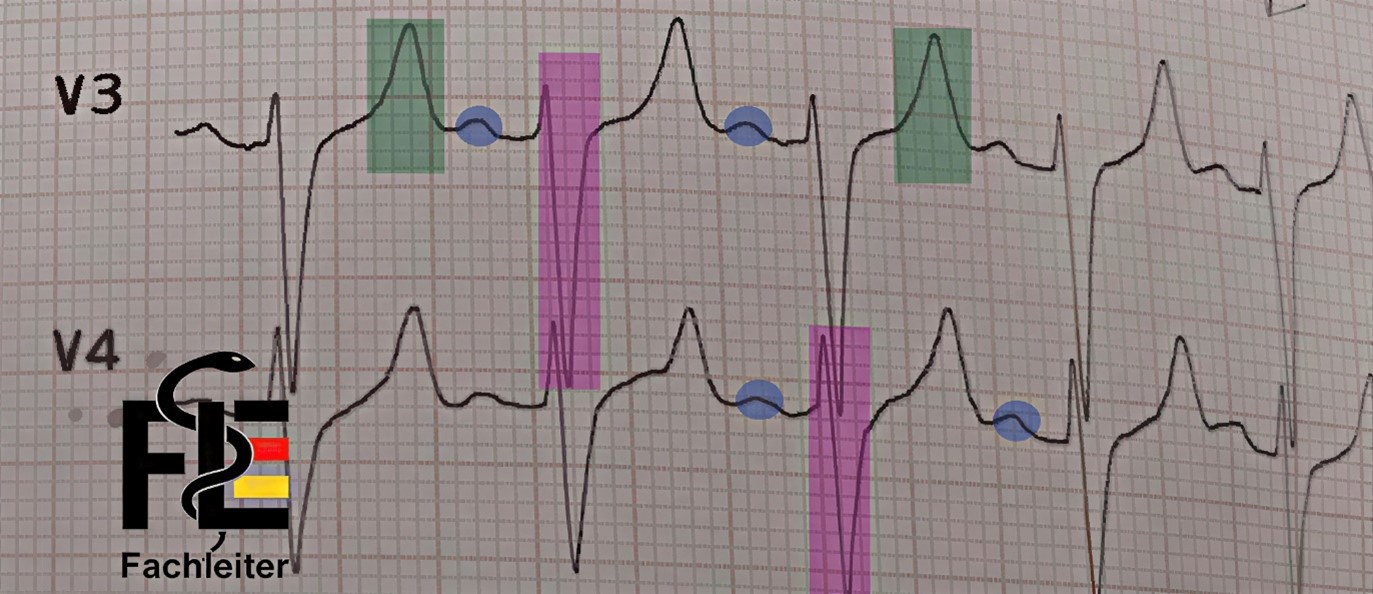
Represents the return of the ventricular myocardium to the resting state (ventricular repolarization). The start of the ST segment at the end of the QRS complex is called the J point. A normal T wave typically has an asymmetric shape — its peak is closer to the end of the wave than to the beginning. The transition between the ST segment and the T wave is not sharply defined and usually cannot be determined exactly. The normal T wave is always negative in lead aVR, positive in lead II, and in adults also positive from lead V3 onward.U wave
Small additional deflection after the T wave. It is associated with the final phase of ventricular repolarization, although the exact mechanism is not clearly understood.Wellen
Fachleiter.org
Fachleiter.org
Fachleiter.org
ECG segments
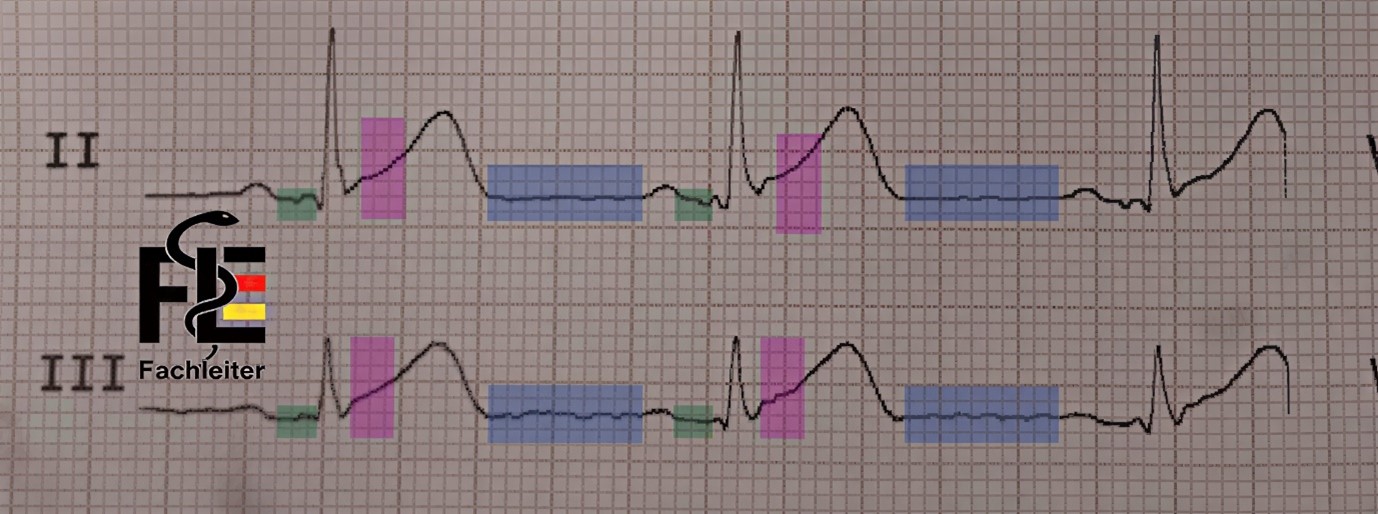
Segments are portions of the ECG that lie between the end of one wave and the start of the next wave.PR segment
Area: from the end of the P wave to the beginning of the QRS complex. Process: Atrial repolarization begins here (it continues during the QRS complex and ends in the ST segment). The PR interval can vary slightly between different leads; therefore when measuring manually the shortest interval should be documented. In adults the normal PR interval is between 0.12 and 0.20 seconds.TP segment
Area: from the end of the T wave to the beginning of the P wave. Meaning: Represents the electrical resting period of the heart. Particular: Serves as the baseline (reference line) for assessing deviations in the PR and ST segments, e.g. in acute pericarditis or myocardial ischemia.ST segment
Area: from the end of the QRS complex to the beginning of the T wave. Meaning: Represents ventricular repolarization (together with the T wave as the “ST-T complex”). Clinically important: ST elevations or depressions are central signs of ischemia or infarction. The normal ST segment is typically isoelectric (i.e. on the baseline, neither positive nor negative). It can, however, be physiologically slightly elevated or depressed — usually by less than 1 mm. The transition between the end of the QRS complex and the start of the ST segment is called the J point.Segmente
Fachleiter.org
Fachleiter.org
ECG intervals
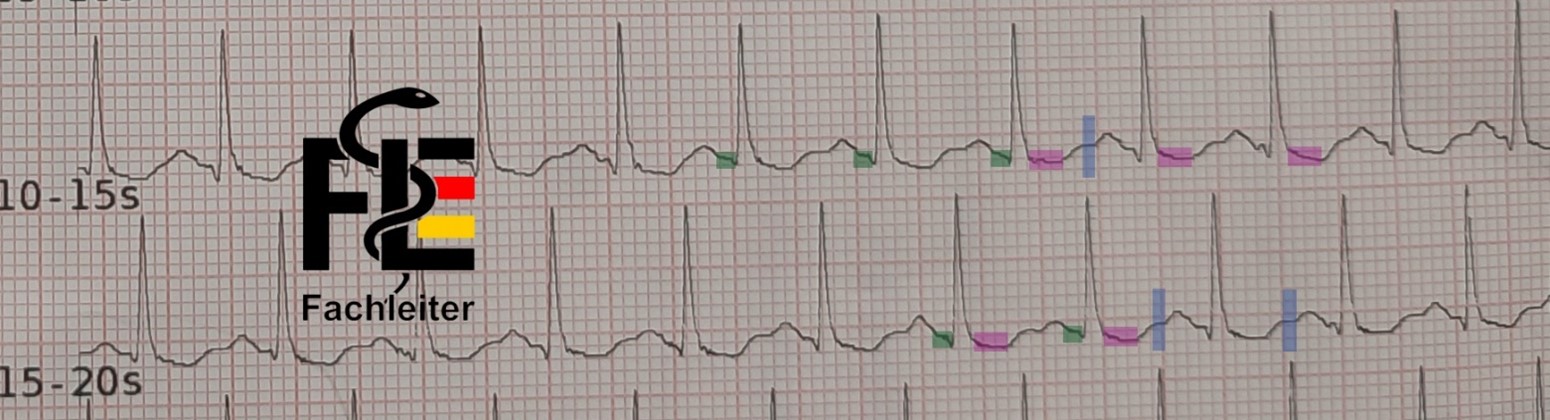
Intervals, by contrast, include at least one complete wave.PR interval
Measured from the beginning of the P wave to the beginning of the QRS complex. It reflects the conduction time from the atria to the ventricles. The PR interval can vary slightly between different leads; therefore when measuring manually the shortest interval should be documented. In adults the normal PR interval is between 0.12 and 0.20 seconds.QRS duration (interval)
Measured from the beginning to the end of the QRS complex. Corresponds to the duration of ventricular excitation (ventricular depolarization).QT interval
Measured from the beginning of the QRS to the end of the T wave. It includes the total time of ventricular depolarization and repolarization. When this interval is adjusted for heart rate it is referred to as QTc. With increasing heart rate (shortened RR interval) the QT interval normally shortens; with decreasing heart rate (prolonged RR interval) the QT interval lengthens accordingly. For assessment, measure the QT interval in the lead(s) in which it appears longest. The QT interval can be easily calculated with an app.RR interval (QRS–QRS)
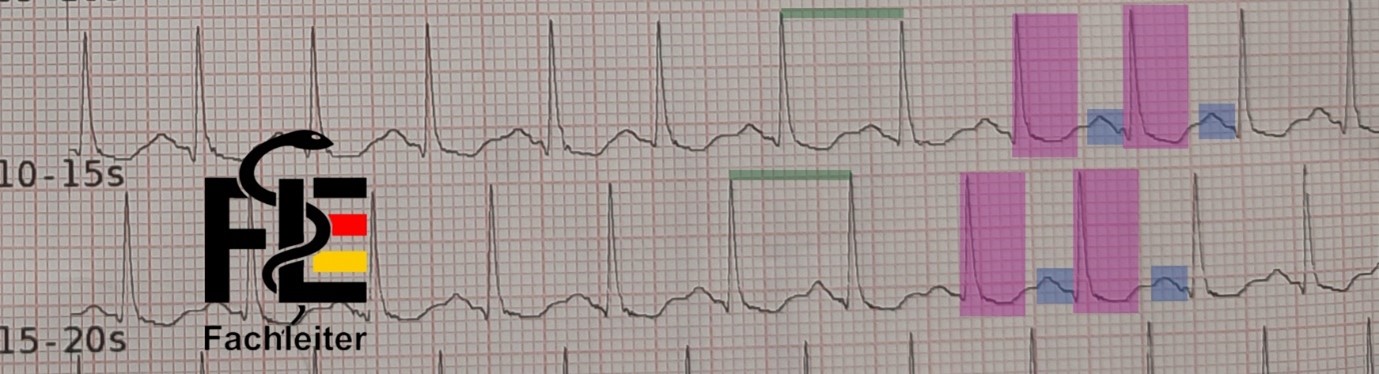
Measured from a point on one QRS (e.g. the R wave) to the same point on the next QRS. From this the heart rate is derived: Heart rate [bpm] = 60 / RR interval [s]. Heart rate (small boxes) = 60 / (number of small boxes × 0.04) Heart rate (large boxes) = 300 / number of large boxes between two R waves Normally the PP interval corresponds to the RR interval, especially in sinus rhythm. In arrhythmias they can differ (e.g. in sinus rhythm with complete AV block).Intervalle
Fachleiter.org
Fachleiter.org
| Category | Elements | Description |
| Waveforms (5) | P, QRS, ST, T, U | Electrical deflections on the ECG |
| Intervals (4) | PR, QRS, QT/QTc, RR/PP | Time spans including at least one wave |
| Segments (3) | PR, ST, TP | Portions between two waves |
An upward deflection is called positive.
Such a positive wave appears in a lead when the electrical excitation (depolarization) of the heart spreads toward the positive pole of that lead.
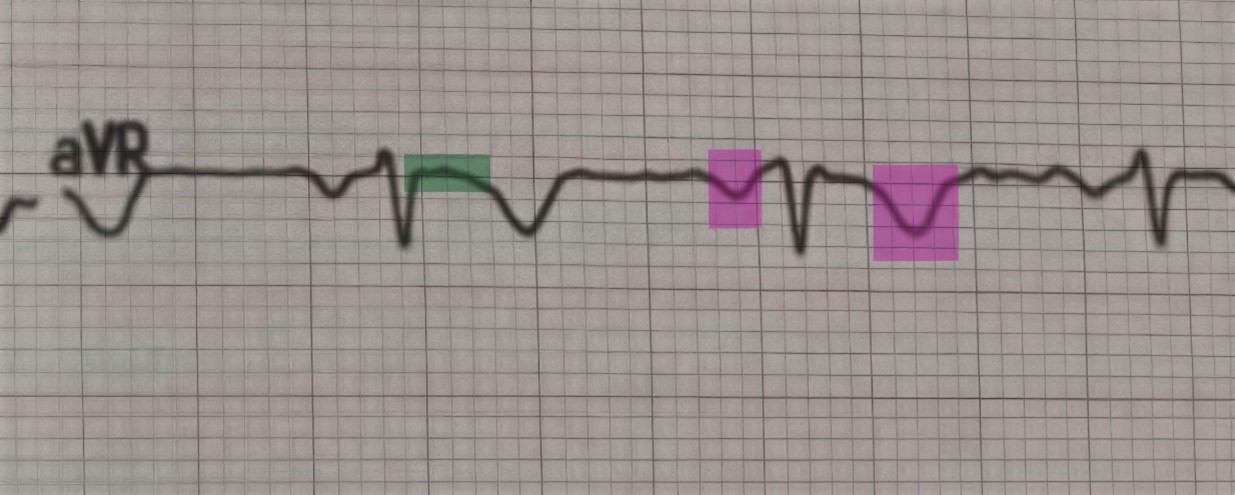
P and T waves are generally positive in all limb leads, except in aVR.
A downward deflection is called negative.
It occurs when the electrical excitation moves toward the negative pole — or away from the positive pole, i.e. in the opposite direction.
P and T waves are normally negative in lead aVR because the excitation moves away from the positive pole.
A deflection that is partly positive and partly negative is called biphasic.
A deflection or wave that runs along the baseline is called isoelectric.
Richtungen
Fachleiter.org
Fachleiter.org
Fachleiter.org
Limb Leads (Limb Leads)
Standard limb leads: I, II and III These are formed according to Einthoven. The following relationship holds: Lead I + Lead III = Lead II The electrode on the right leg serves exclusively as electrical ground. Augmented unipolar limb leads: aVR, aVL and aVF The following holds: aVR + aVL + aVF = 0Precordial (Chest) leads: V1 to V6
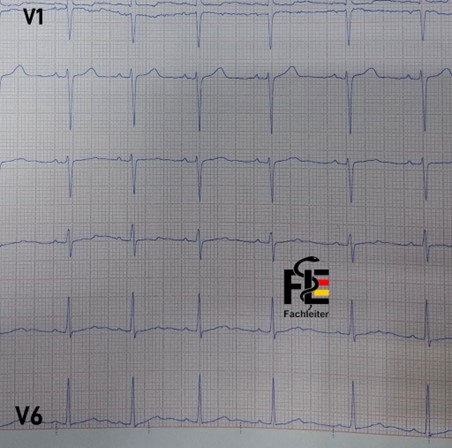
To find the fourth intercostal space, place your finger on the upper edge of the sternum (breastbone) and move it slowly downward. About 4 cm lower you can feel a small horizontal ridge – the so-called Angulus Ludovici (Louis angle). At this point the Manubrium sterni (upper part of the breastbone) transitions into the Corpus sterni (main part of the breastbone). The second intercostal space is located directly below and slightly lateral to this point. Counting two spaces further down you reach the fourth intercostal space – V1 is placed here. Since breast tissue can impede accurate electrode positioning, the chest leads (V3 to V6) should be placed as far below the breast tissue as possible to ensure precise and reproducible placement. V2: in the fourth intercostal space to the left of the sternum V3: between V2 and V4 on a straight line V4: in the fifth intercostal space on the midclavicular line (mid-clavicle line) V5: in the anterior axillary line at the same level as V4 V6: in the midaxillary line, also at the level of V4 If the electrodes are placed too high, voltages from higher interspaces are measured, which leads to erroneous tracings. The nipples must under no circumstances be used as landmarks – neither in men nor in women – because their position varies greatly between individuals.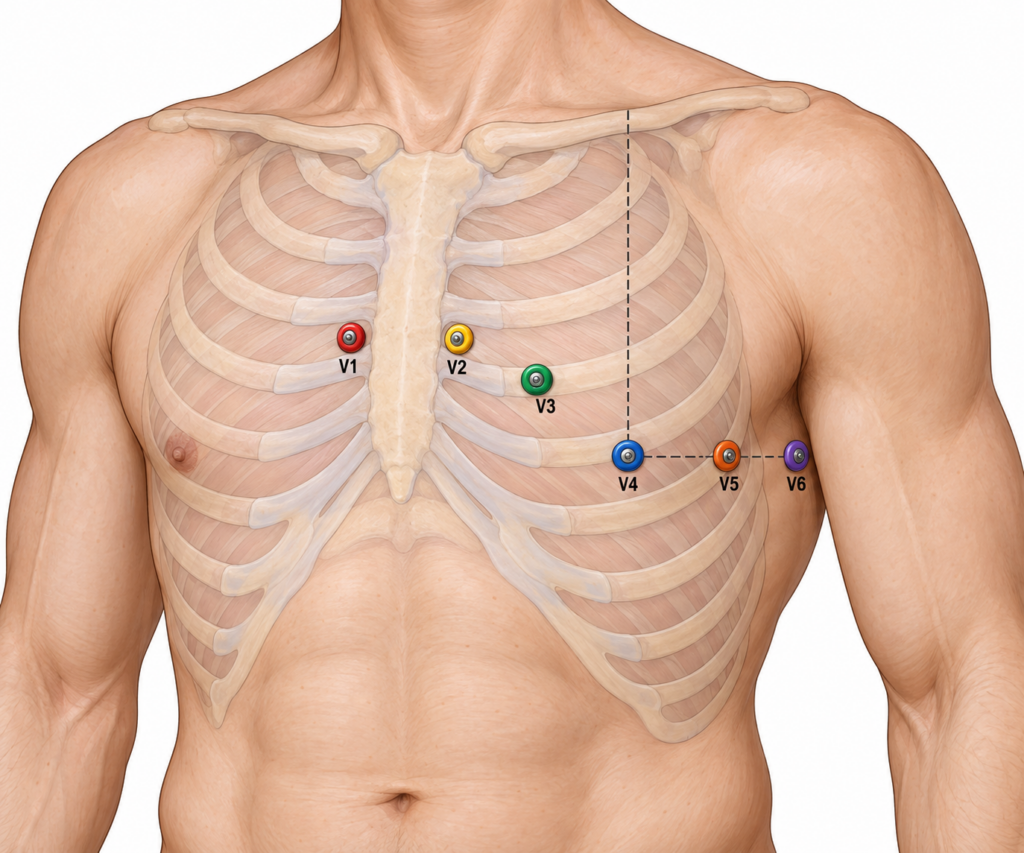
QRS complex
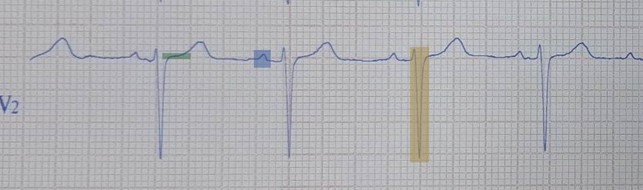
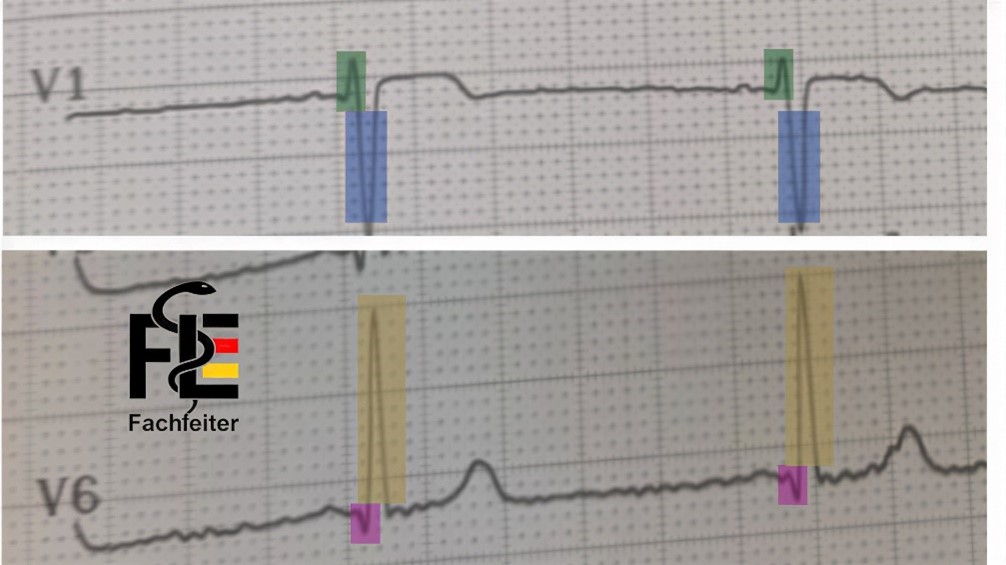
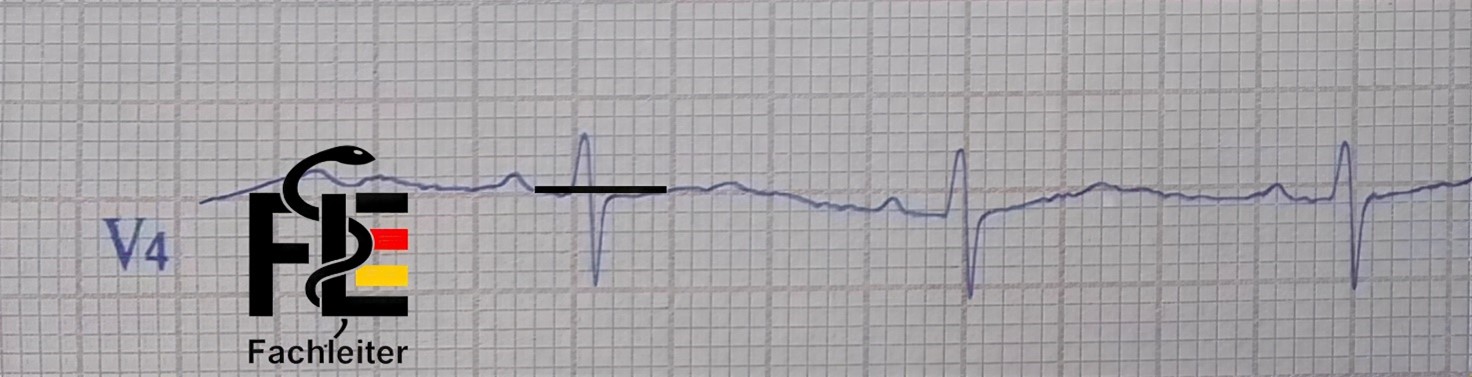
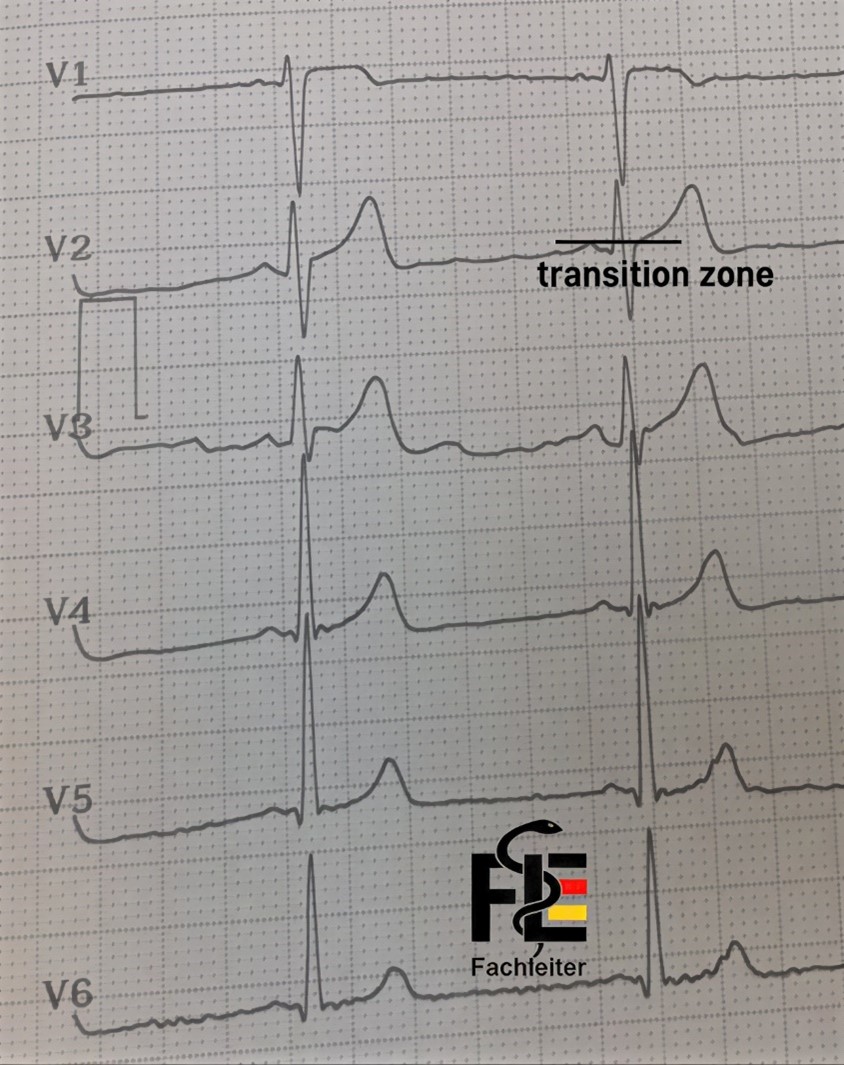
The QRS complex is typically predominantly negative in the right precordial leads and in aVR, while it appears predominantly positive in the left-sided chest leads and in lead II. The initial depolarization phase produces in V1 a small positive deflection (r-wave) and simultaneously in V6 a small negative deflection (q-wave). Subsequently V1 shows a deep negative S-wave, while V6 exhibits a tall positive R-wave.QRS-Komplex
Fachleiter.org
Fachleiter.org
R-Wellen-Progression
Fachleiter.org
Fachleiter.org
Fachleiter.org
Electrical heart axis
In the ECGs of most adults, the electrical heart axis is normally between –30° and +100°. An axis of –30° or less is called left axis deviation (LAD), while an axis of +100° or more is considered right axis deviation (RAD).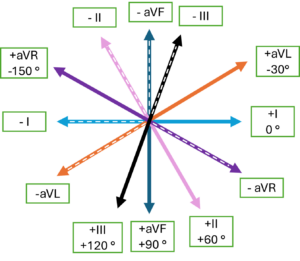
Determination of the electrical heart axis
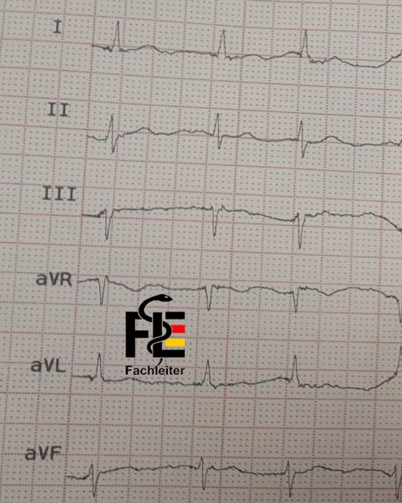
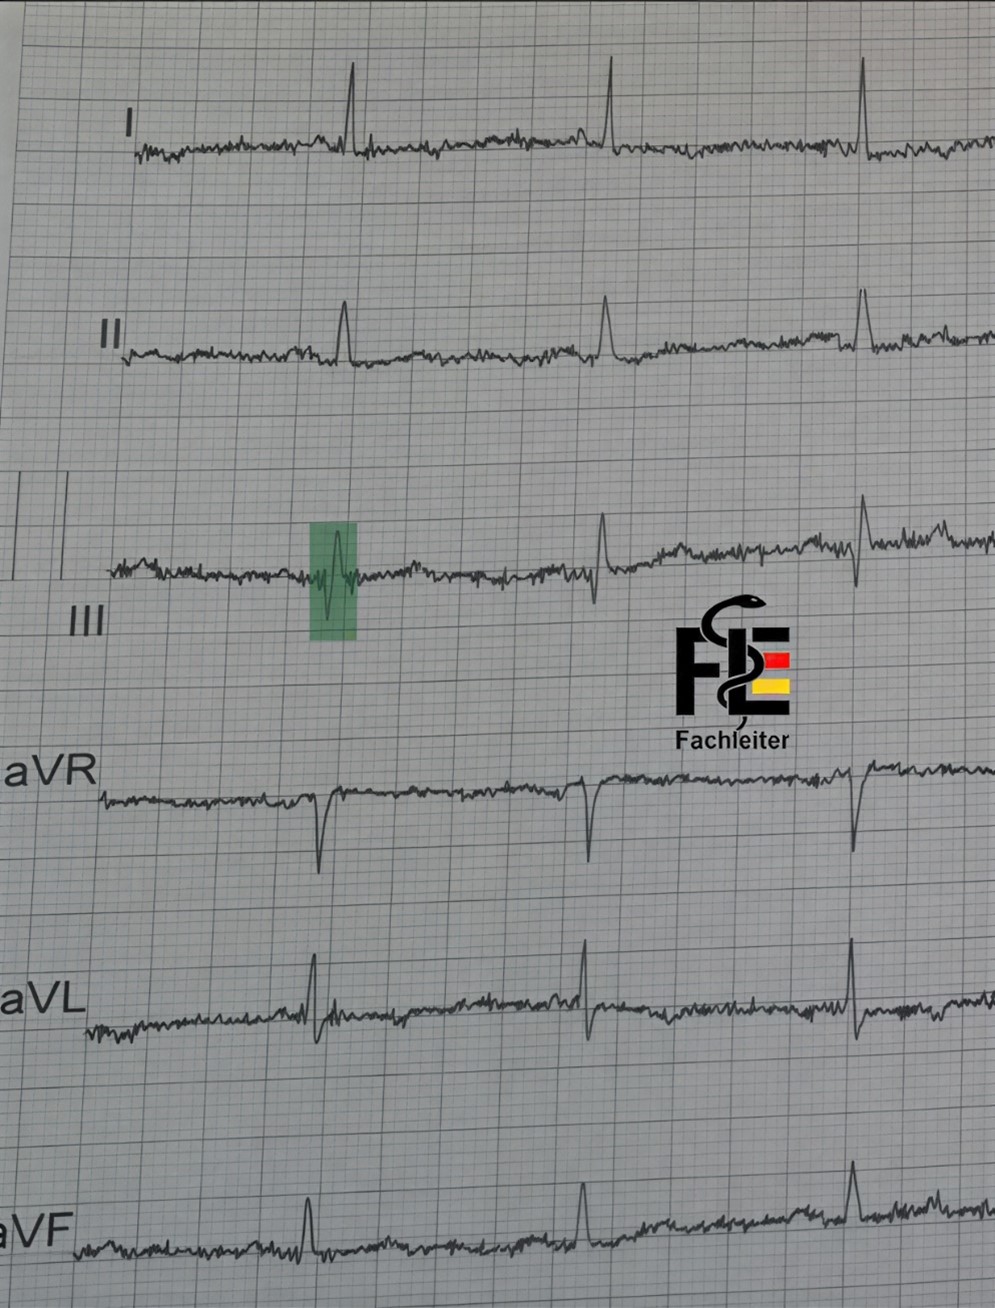
Example 1 In lead II the Q and R waves are about equal in size, which indicates that the electrical axis runs perpendicular to this lead, i.e. is at about +90° or –90°. If you subtract 90° from the direction of lead II (60°), you get –30° or +150°. Since aVL is positive, the axis is directed toward aVL — therefore at about –30°. Example 2 In lead III the Q and R waves are about equal in size, which indicates that the electrical axis runs perpendicular (orthogonal) to this lead, i.e. at about +90° or –90°. Because aVR is negative and leads I and II are positive, the depolarization is directed downwards and to the left, placing the heart axis within the normal range. Example 3 Leads II and aVF show a negative QRS complex, meaning that the depolarization is going in the opposite direction (i.e. between –II and –aVF, corresponding to about –90° to –120°). Since lead I is positive, the electrical axis points up and to the left — this is a left axis deviation (LAD). (QRS complex in aVR, indicating that the electrical axis is perpendicular to this lead, i.e. at about +90° or –90°.) Summary: If the QRS complexes in leads I and II are positive, the electrical axis is within the normal range. If the QRS complex in I is positive and in II negative, this suggests left axis deviation (LAD), as seen in left anterior hemiblock (LAH), left ventricular hypertrophy, or inferior myocardial infarction. If the QRS complex in I is negative and in II positive, this indicates right axis deviation (RAD) or a borderline right axis type, as seen in right ventricular hypertrophy, right bundle branch block (RBBB), or lateral myocardial infarction.Achse-Übung
1
2
3